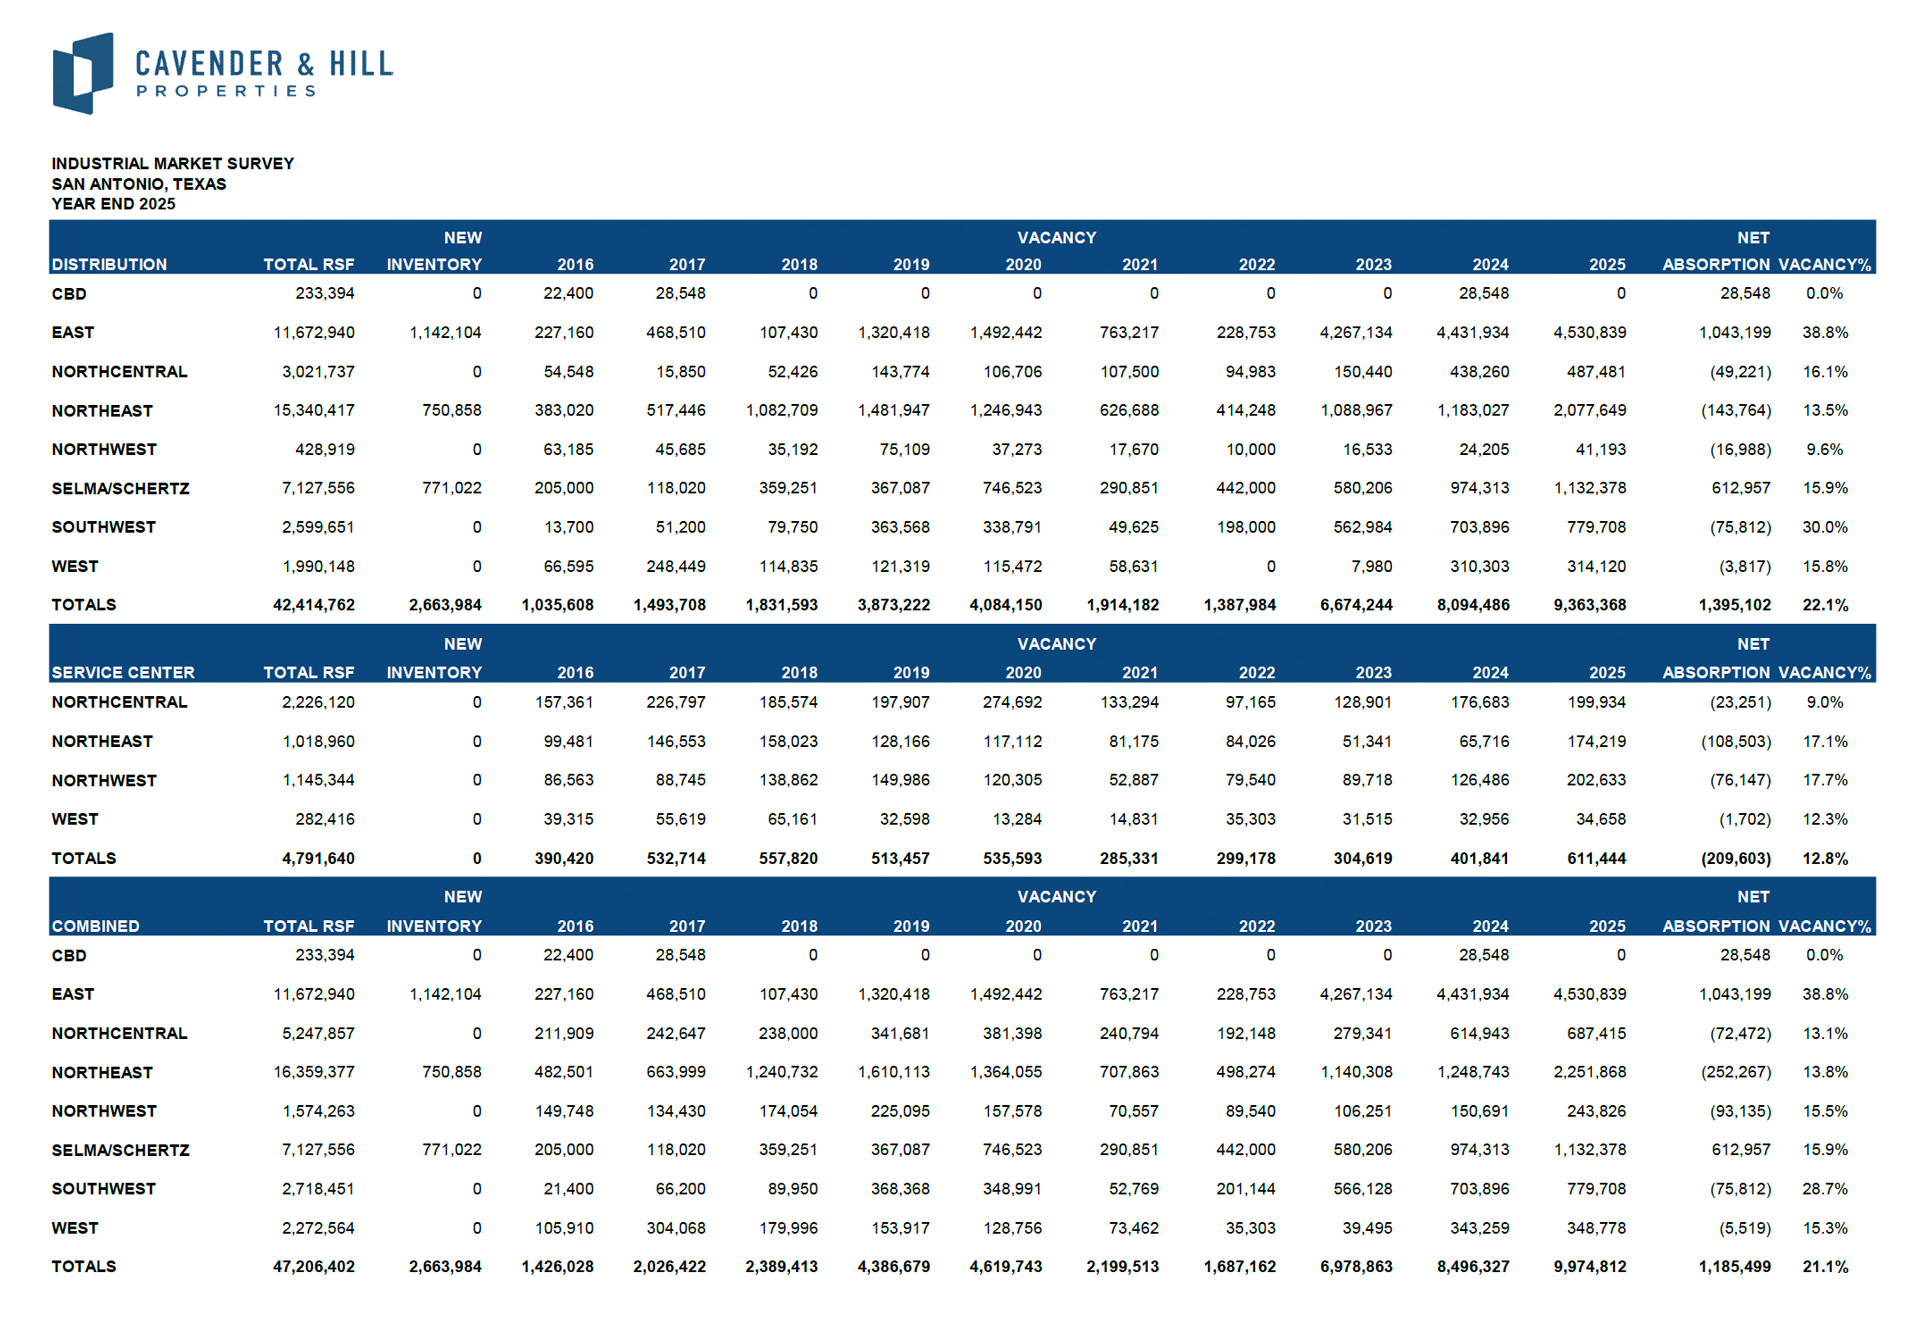
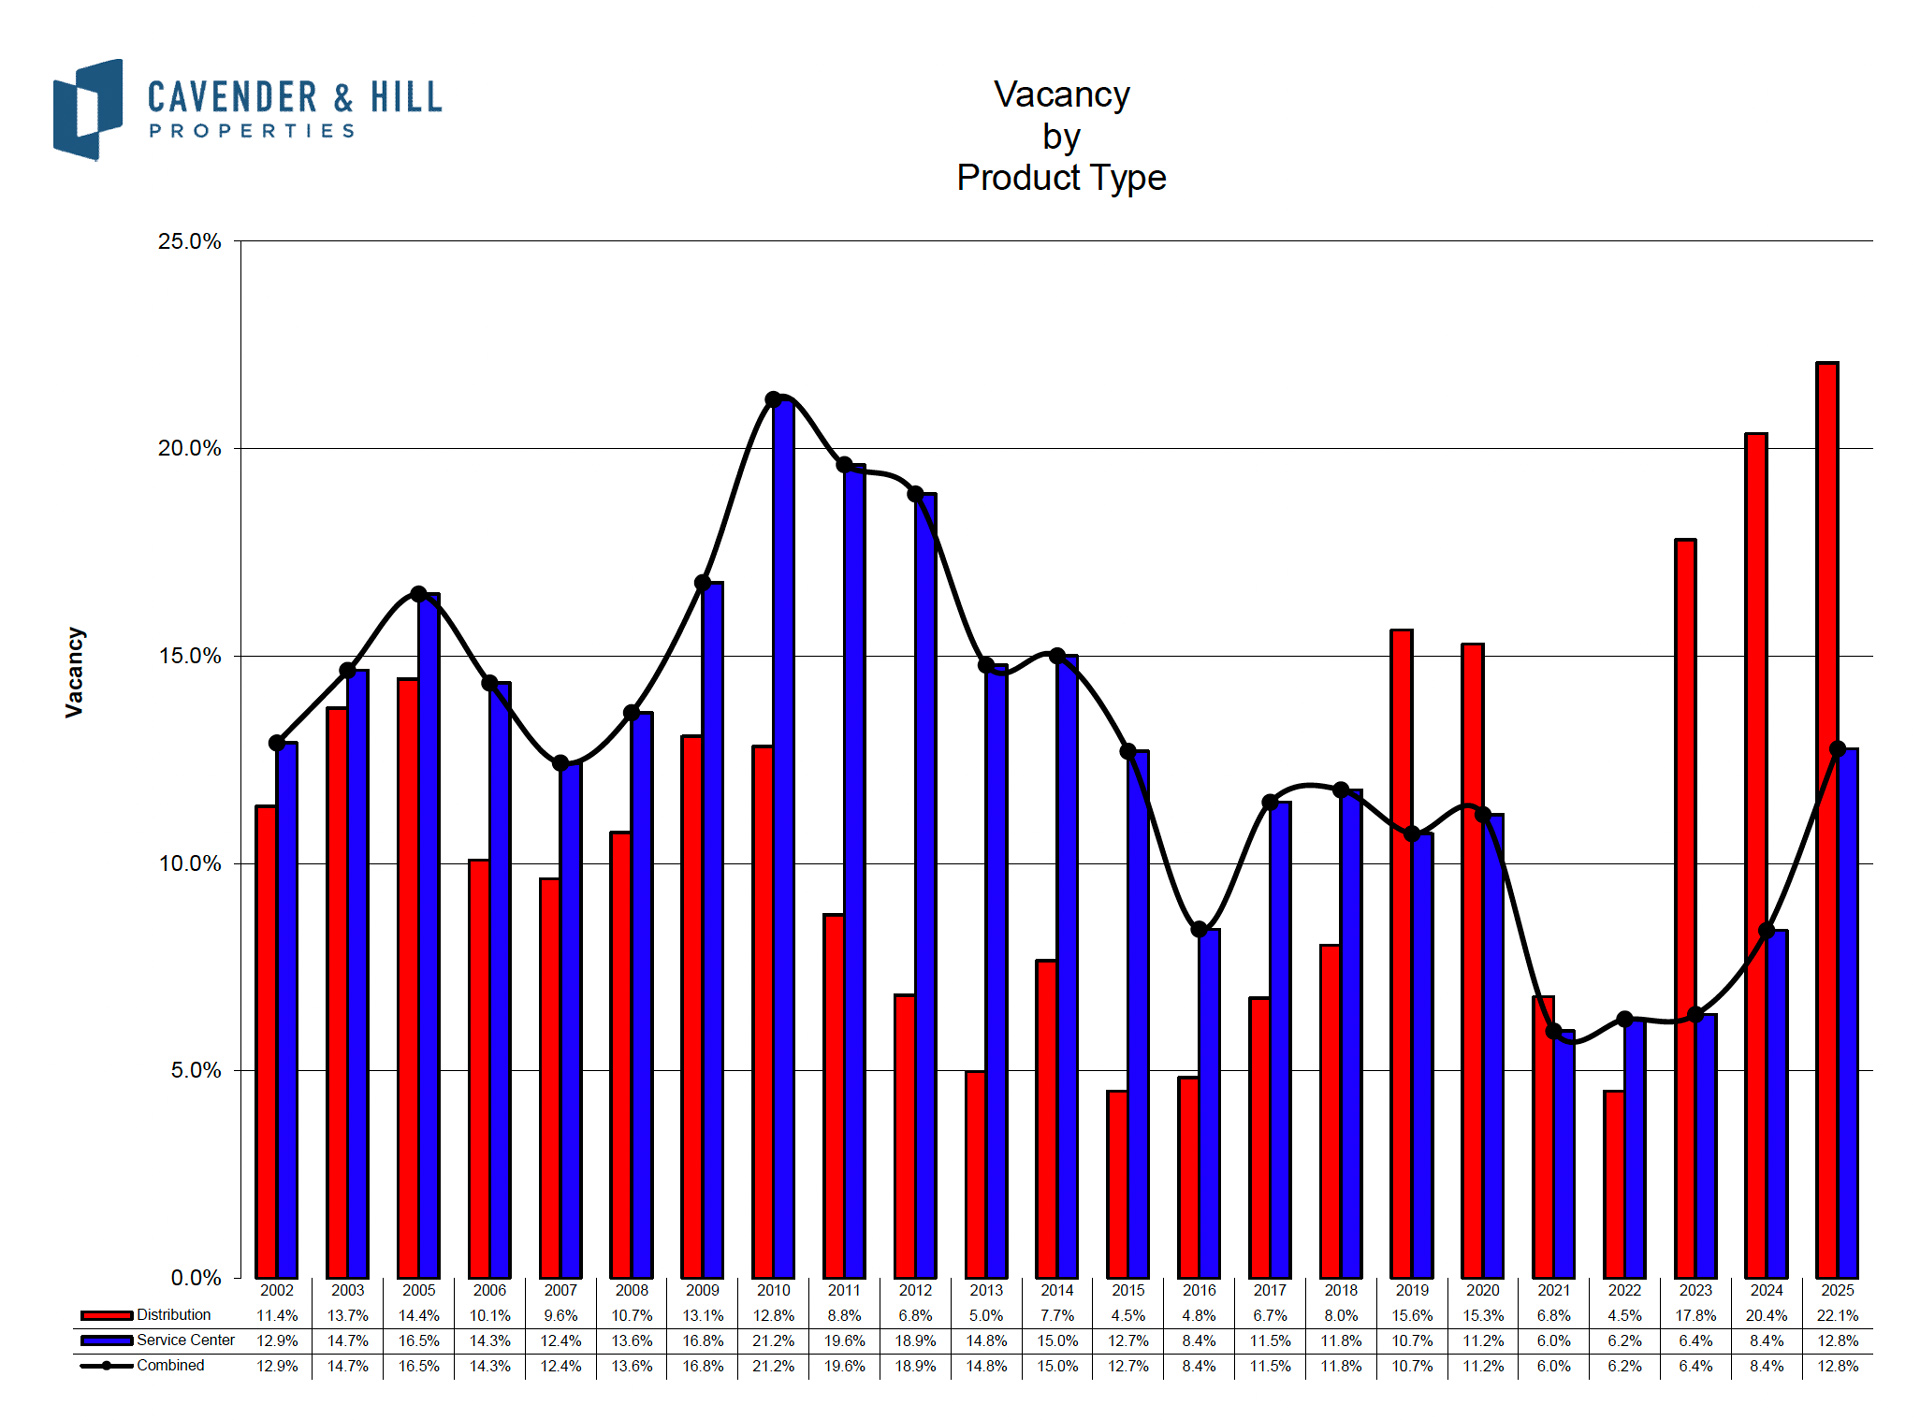
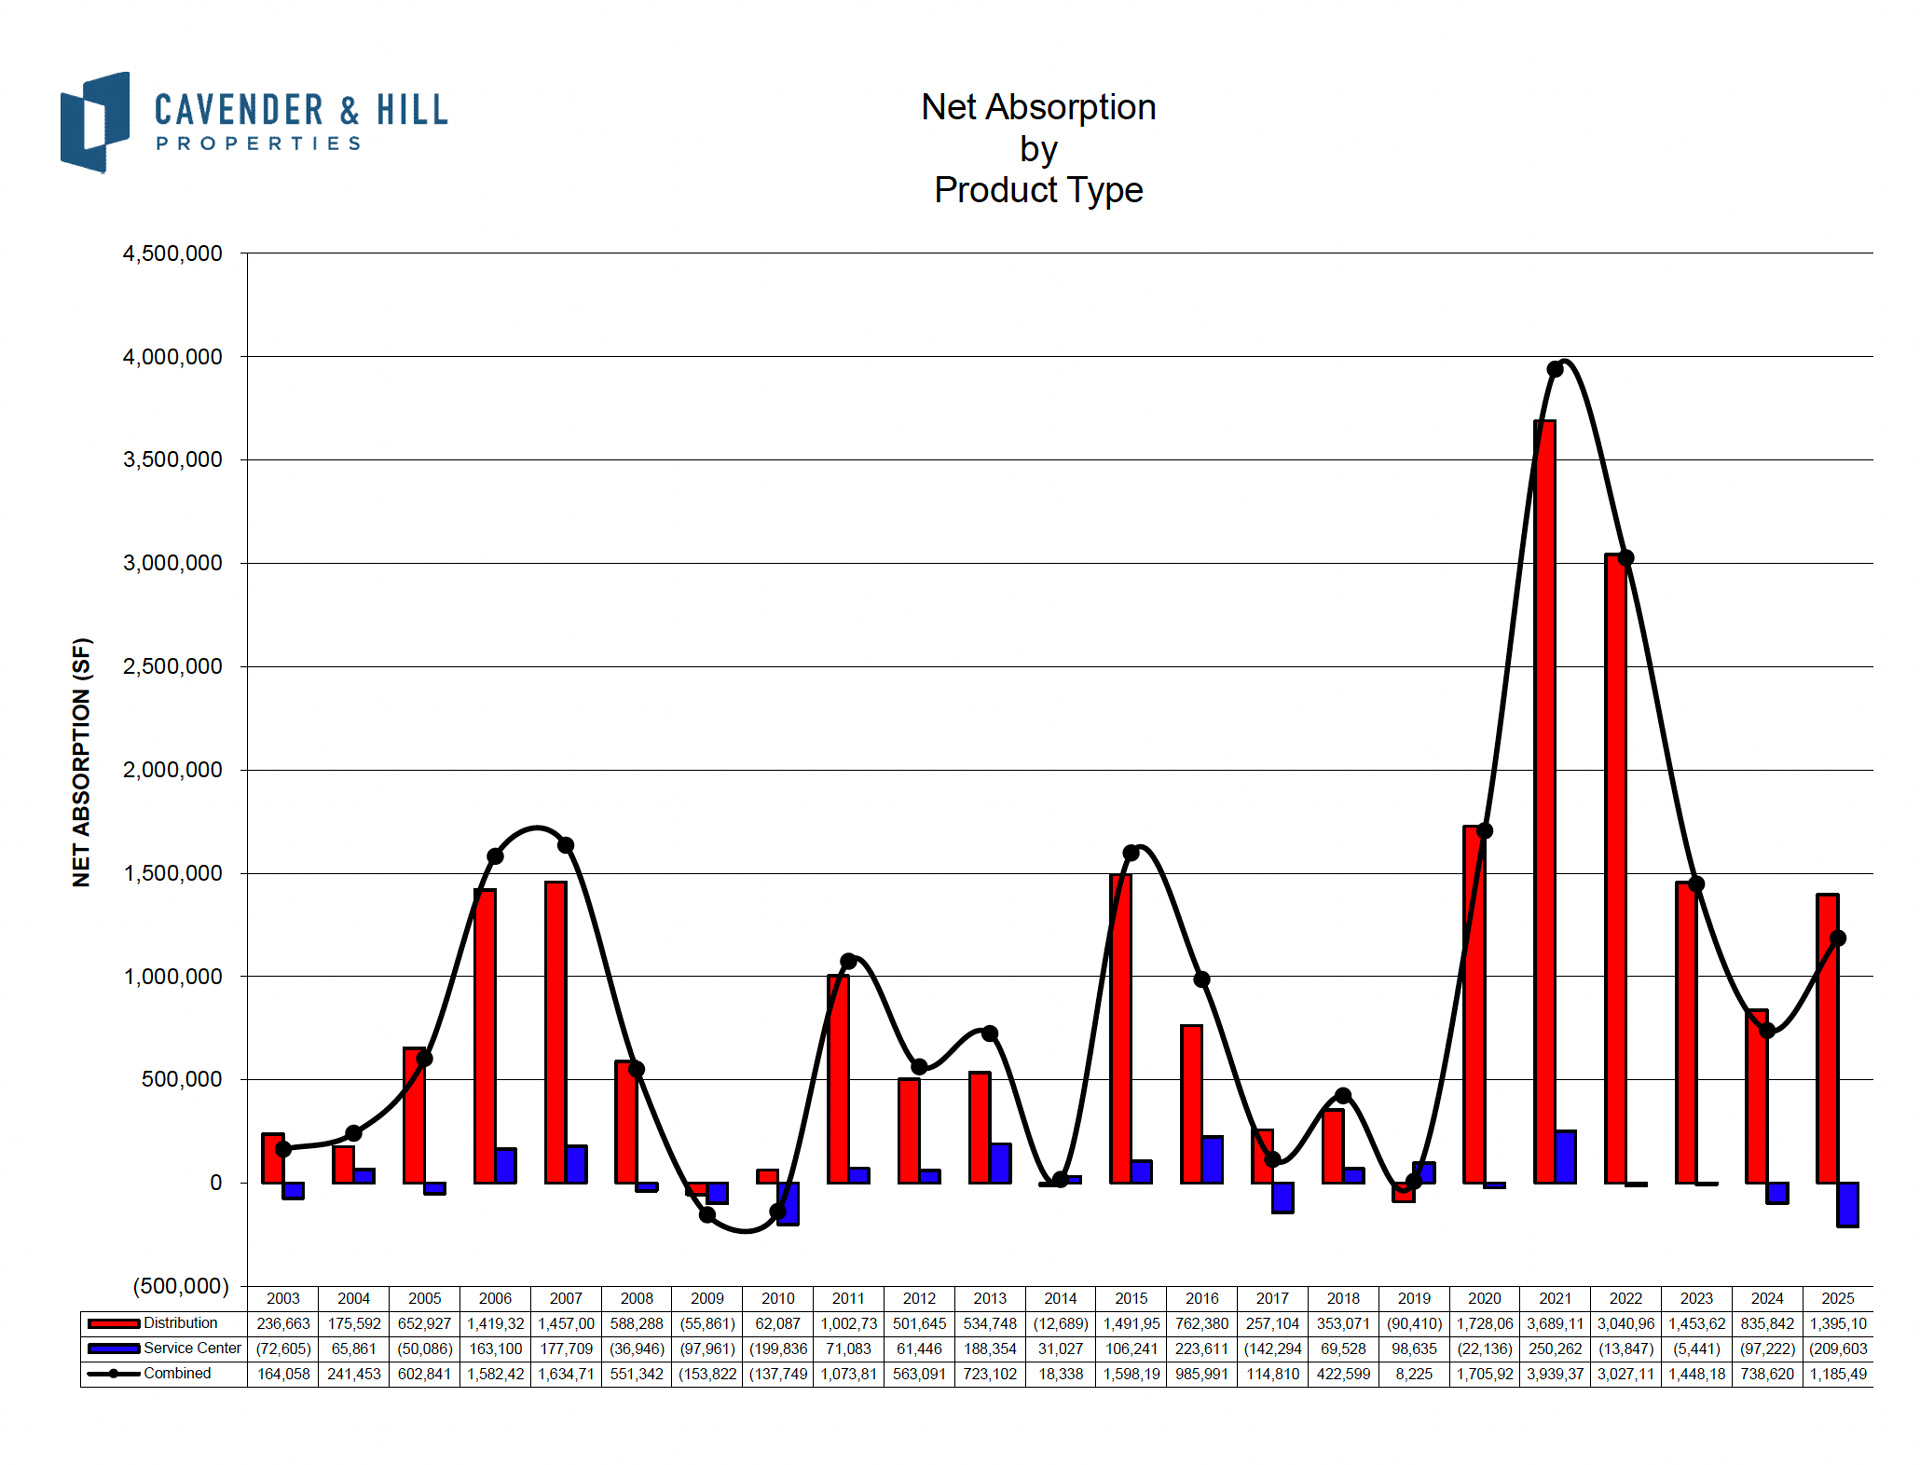
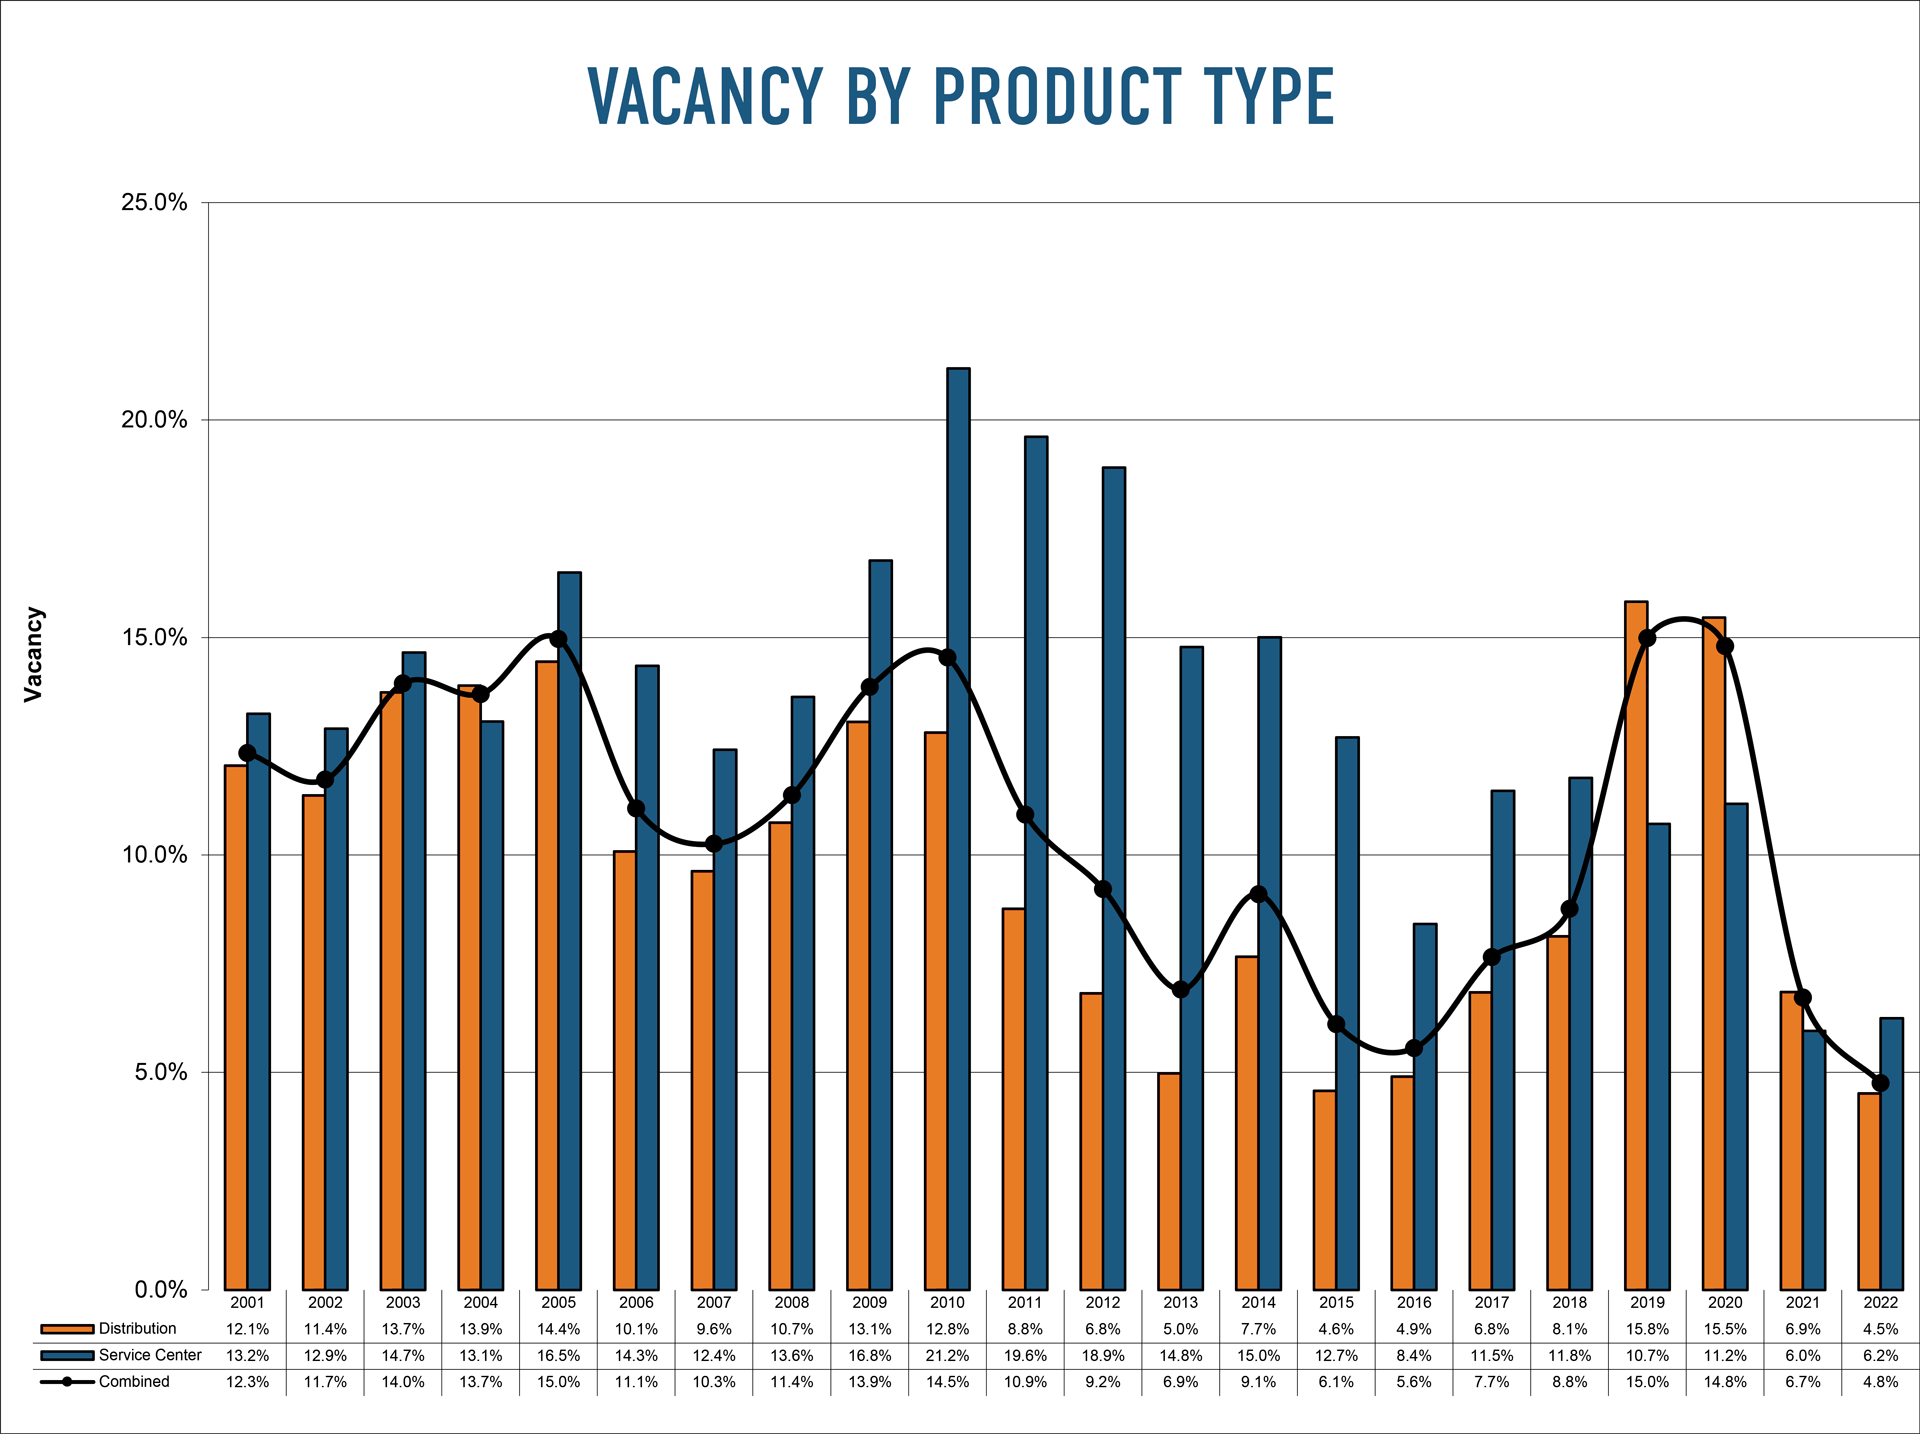
Discover a wealth of insights in our comprehensive annual market survey, featuring 30 years of historical occupancy and absorption data for over 240 competitive industrial properties in San Antonio. Delve into our latest survey summary, which unveils key highlights and trends shaping the local industrial property market. To enhance your experience, don’t miss our Useful Links section, offering additional resources and tools to support your informed decision-making in the dynamic real estate landscape.
Maureen is a licensed real estate professional and oversees all aspects of Marketing at Cavender & Hill Properties, concentrating on crafting and executing strategic marketing initiatives that powerfully showcase the company’s properties and services. Her responsibilities encompass brand marketing, digital marketing, and content marketing. She manages and maintains the company website, ensuring its relevance and effectiveness in conveying the company’s message.
Before joining Cavender & Hill, Maureen dedicated her skills as an English Language Arts and Reading (ELAR) Teacher. In this role, she played a pivotal part in fostering her students’ writing, reading comprehension, listening, and speaking abilities. Additionally, she gained valuable expertise while serving as an Engagement Manager at a Houston-based technology firm. In this capacity, Maureen efficiently supervised the management and delivery of products and services, providing crucial support to clients in achieving their business objectives.
In addition to her professional experience, Maureen holds a Bachelor of Arts in Communication Arts with a concentration in Journalism and a minor in English from the University of the Incarnate Word. Ms. Johnson is an active member of the CREW (Commercial Real Estate Women) Network, an organization dedicated to supporting, empowering, and advancing women in commercial real estate.