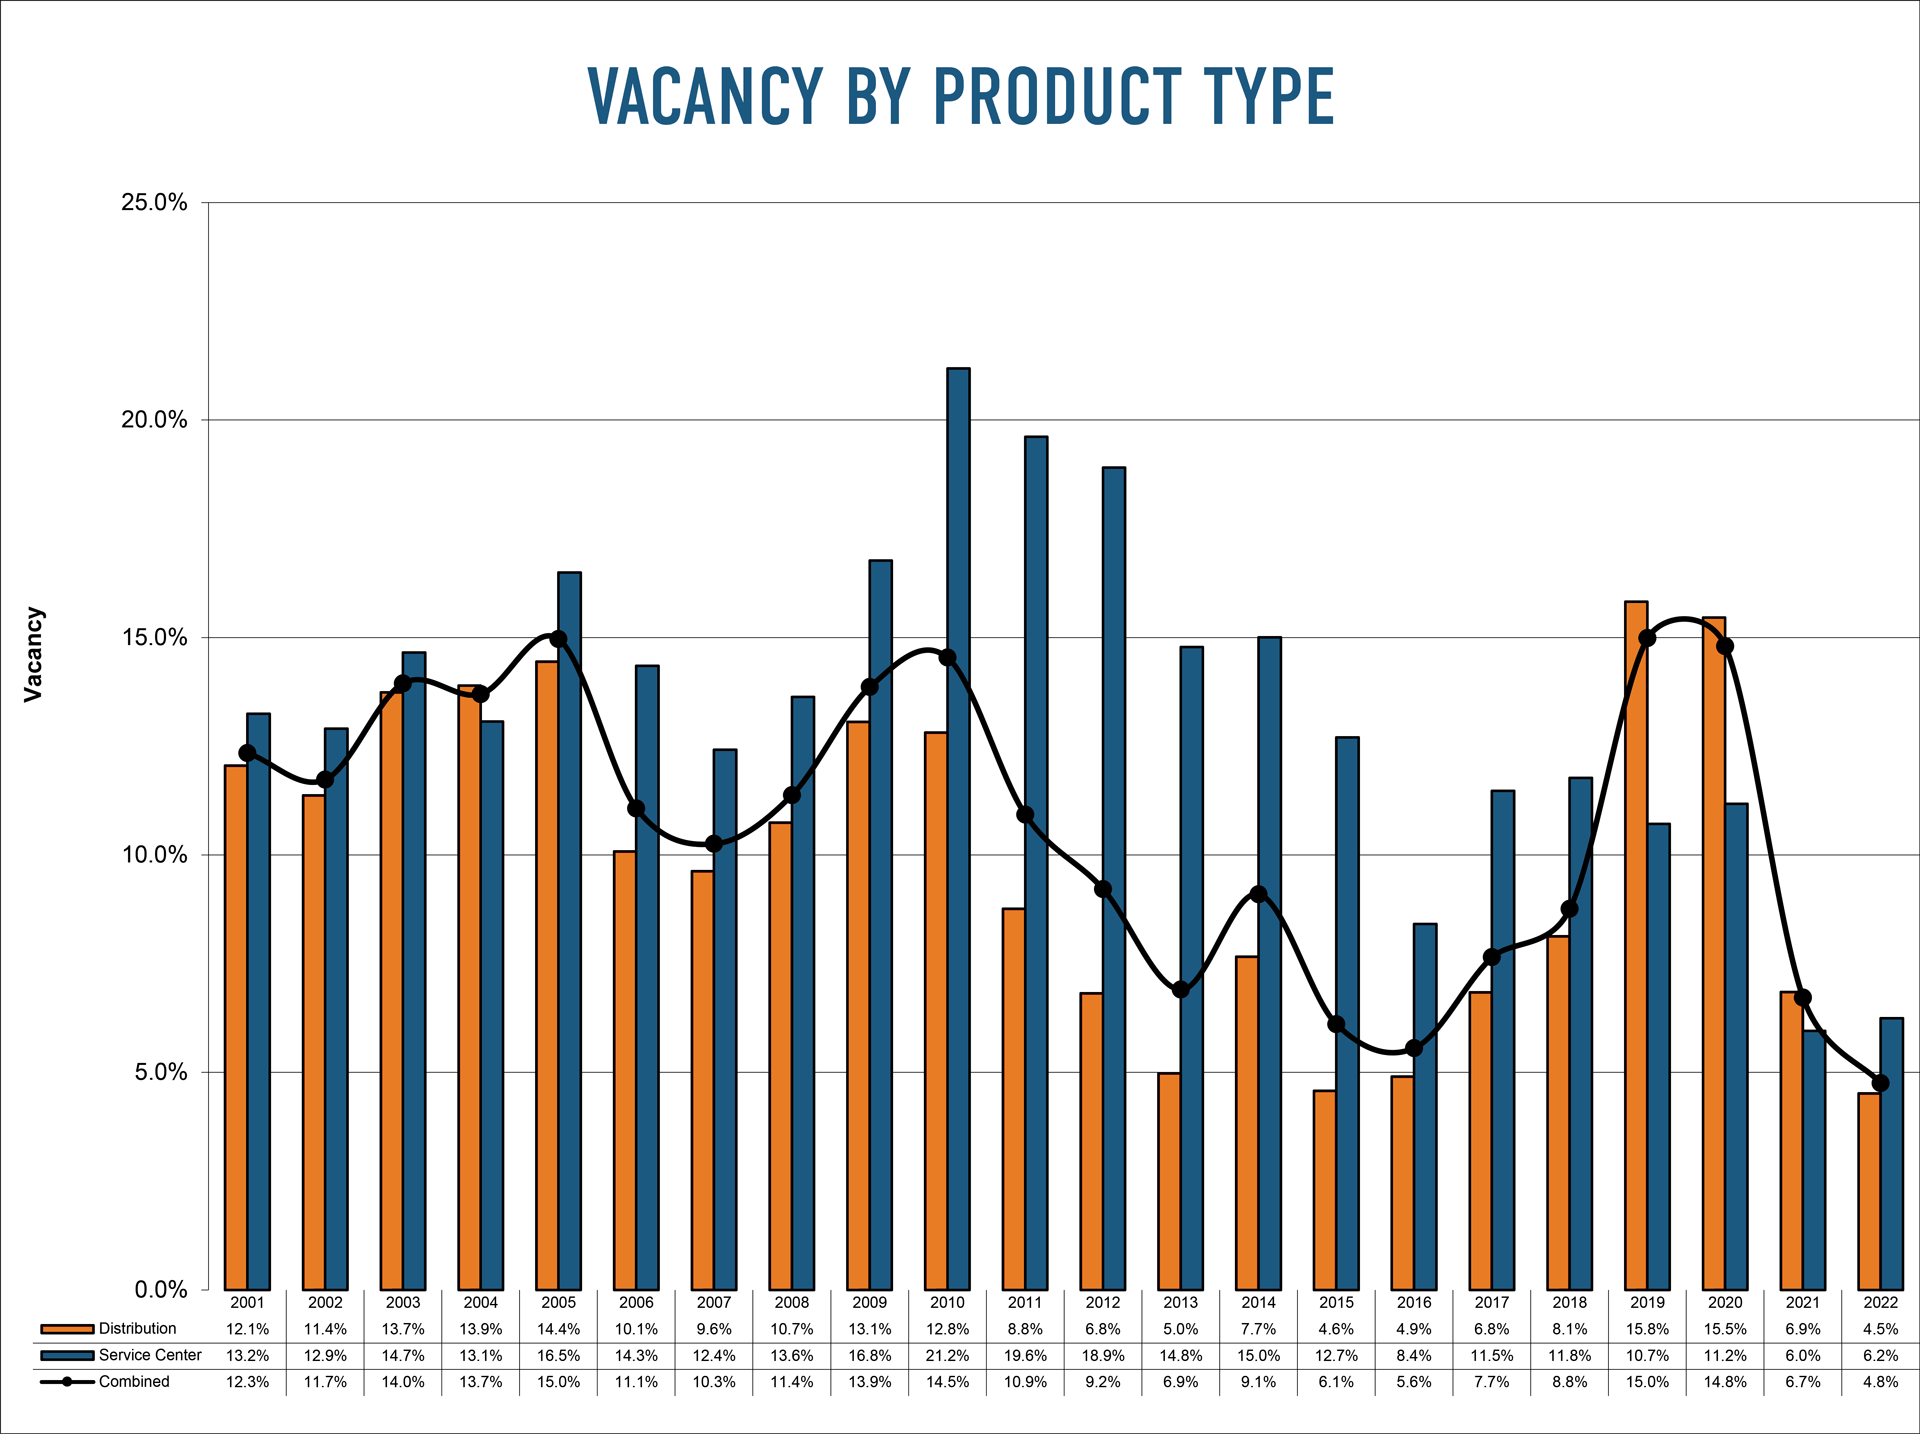
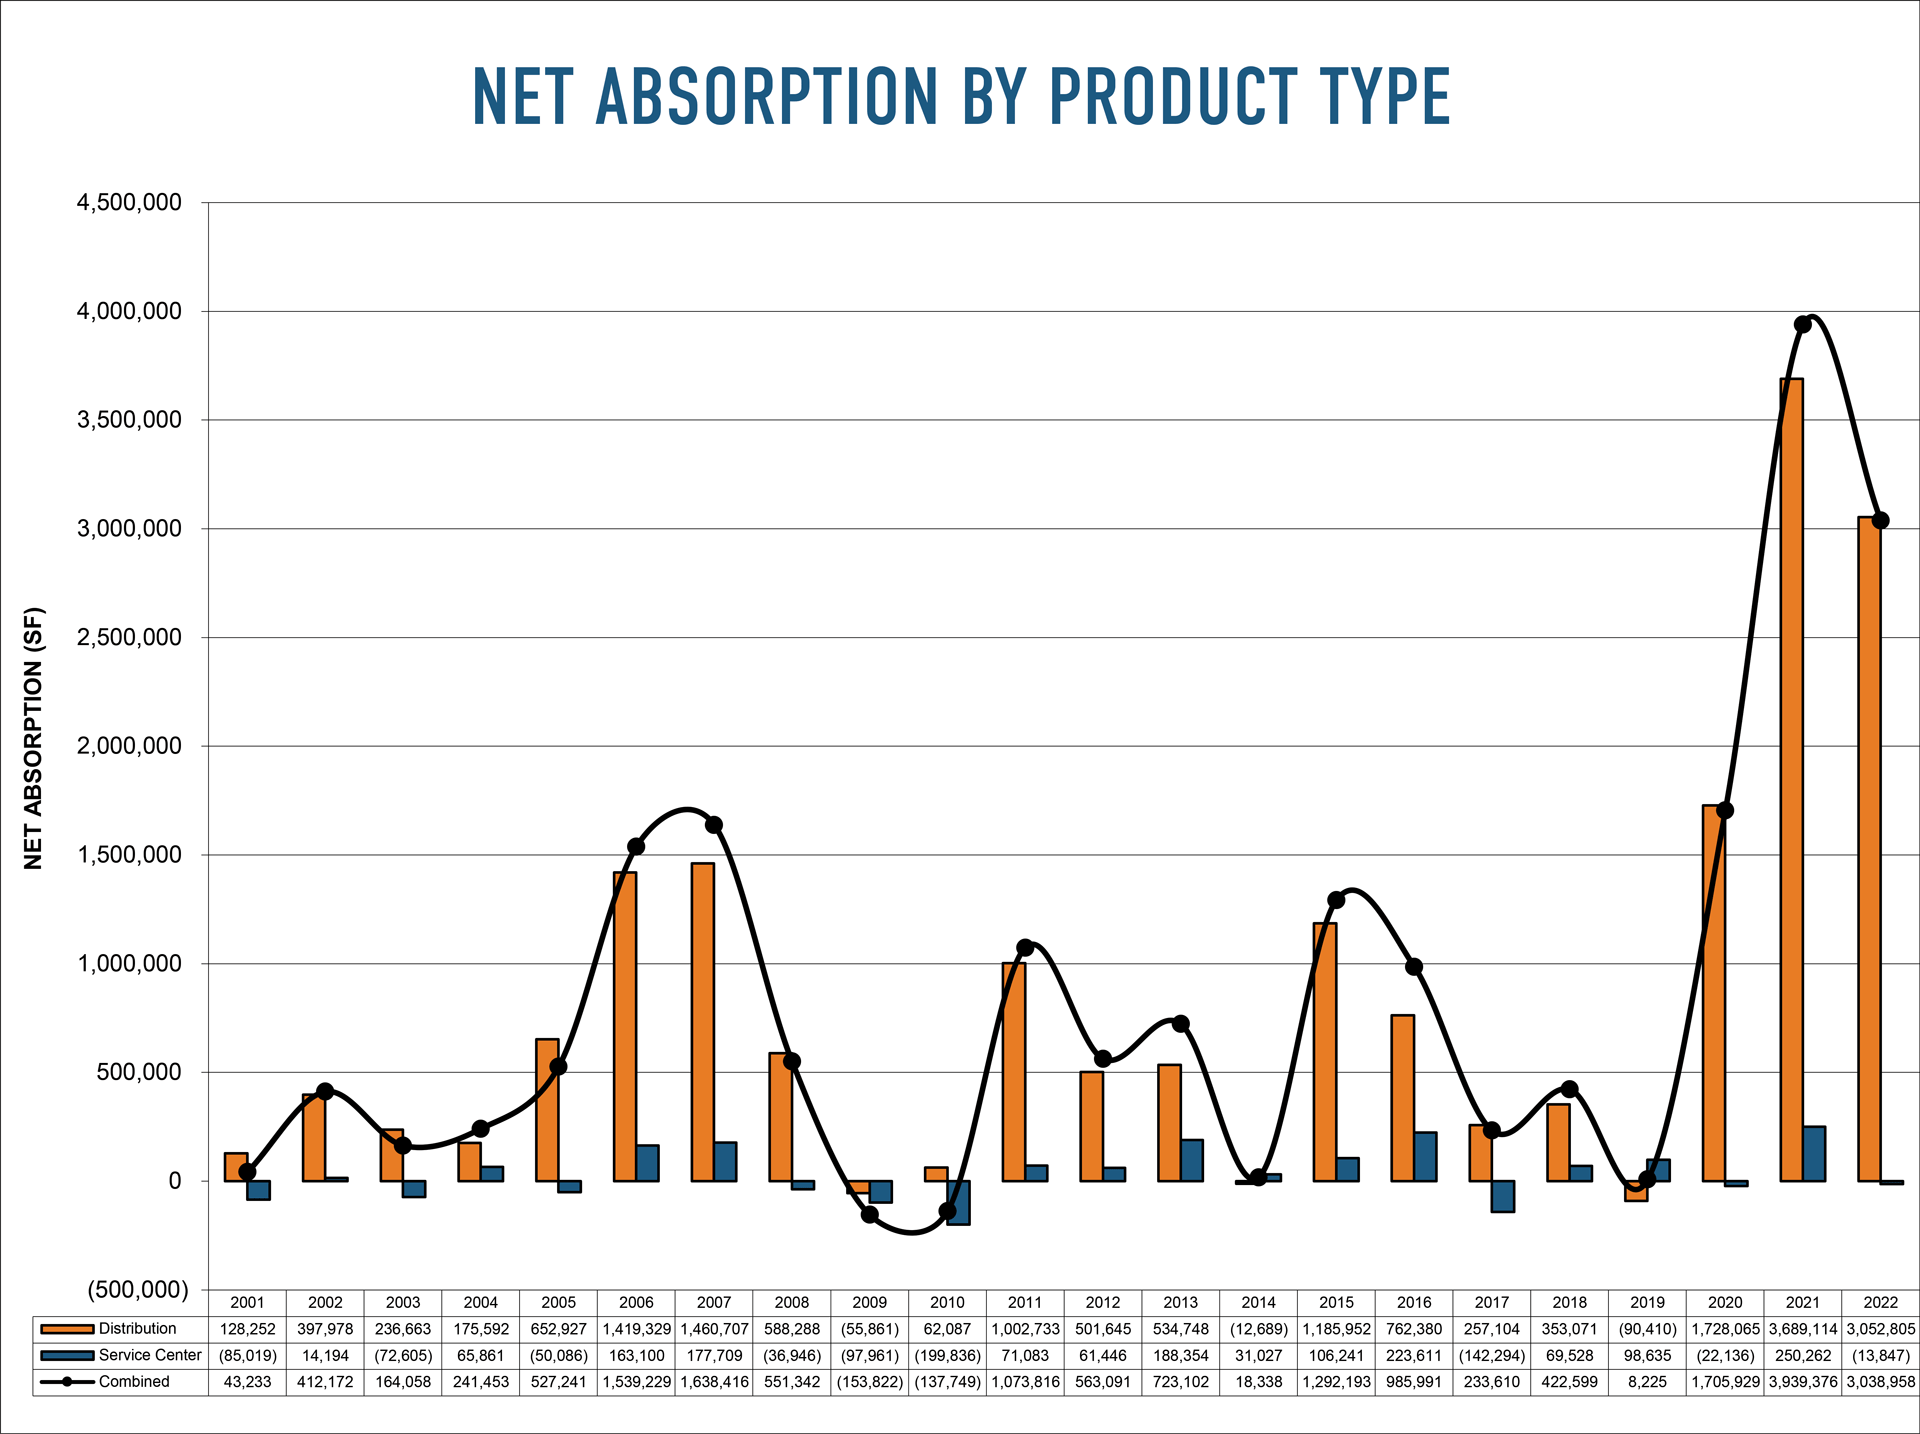
Market
Survey

We publish a semi-annual market survey incorporating 23 years of historical occupancy and absorption data for more than 150 competitive industrial properties in the San Antonio area. Below is a summary of our most recent survey or click here for the full PDF report.
| Submarket | RSF | New Product |
Vacant 12/31/06 |
Vacant 12/31/07 |
Vacant 12/31/08 |
Vacant 12/31/09 |
Vacant 12/31/10 |
Vacant 12/31/11 |
Net Absorption |
Occ % |
|---|---|---|---|---|---|---|---|---|---|---|
| Distribution | ||||||||||
| CBD | 233,394 | 0 | 0 | 0 | 0 | 28,548 | 54,734 | 55,660 | (926) | 76.2 |
| East | 1,748,587 | 0 | 98,354 | 303,300 | 278,692 | 381,038 | 202,600 | 103,050 | 99,550 | 94.1 |
| Northcentral | 2,251,676 | 0 | 140,600 | 76,400 | 190,774 | 212,291 | 325,921 | 217,128 | 108,793 | 90.4 |
| Northeast | 11,958,683 | 0 | 1,074,261 | 969,289 | 1,224,297 | 1,236,682 | 1,284,946 | 1,002,351 | 282,595 | 91.6 |
| Northwest | 428,919 | 0 | 0 | 30,226 | 81,277 | 116,290 | 155,042 | 119,398 | 35,644 | 72.2 |
| Southwest | 965,000 | 0 | 292,100 | 306,200 | 191,800 | 422,600 | 306,930 | 117,200 | 189,730 | 87.9 |
| West | 955,107 | 0 | 101,138 | 60,100 | 79,176 | 109,365 | 129,614 | 120,330 | 9,284 | 87.4 |
| Totals | 18,541,366 | 0 | 1,706,453 | 1,745,515 | 2,046,016 | 2,506,814 | 2,459,787 | 1,735,117 | 724,670 | 90.6 |
| Service Center | ||||||||||
| CBD | 0 | 0 | 0 | 0 | 0 | 0 | 0 | 0 | 0 | 0.0 |
| East | 0 | 0 | 0 | 0 | 0 | 0 | 0 | 0 | 0 | 0.0 |
| Northcentral | 2,242,902 | 0 | 284,782 | 230,820 | 275,688 | 357,653 | 421,863 | 392,116 | 29,747 | 82.5 |
| Northeast | 1,082,599 | 0 | 98,459 | 105,696 | 149,709 | 110,928 | 193,965 | 176,542 | 17,423 | 83.7 |
| Northwest | 1,018,986 | 0 | 120,939 | 122,624 | 120,035 | 169,419 | 187,507 | 180,716 | 6,791 | 82.3 |
| Southwest | 0 | 0 | 0 | 0 | 0 | 0 | 0 | 0 | 0 | 0.0 |
| West | 288,904 | 0 | 34,667 | 38,635 | 45,349 | 89,945 | 119,581 | 112,729 | 6,852 | 61.0 |
| Totals | 4,633,391 | 0 | 538,847 | 497,775 | 590,781 | 727,945 | 922,916 | 862,103 | 60,813 | 81.4 |
| Combined | ||||||||||
| CBD | 233,394 | 0 | 0 | 0 | 0 | 28,548 | 54,734 | 55,660 | (926) | 76.2 |
| East | 1,748,587 | 0 | 98,354 | 303,300 | 278,692 | 381,038 | 202,600 | 103,050 | 99,550 | 94.1 |
| Northcentral | 4,494,578 | 0 | 425,382 | 307,220 | 466,462 | 569,944 | 747,784 | 609,244 | 138,540 | 86.4 |
| Northeast | 13,041,282 | 0 | 1,172,720 | 1,074,985 | 1,374,006 | 1,347,610 | 1,478,911 | 1,178,893 | 300,018 | 91.0 |
| Northwest | 1,447,905 | 0 | 120,939 | 152,850 | 201,312 | 285,709 | 342,549 | 300,114 | 42,435 | 79.3 |
| Southwest | 965,000 | 0 | 292,100 | 306,200 | 191,800 | 422,600 | 306,930 | 117,200 | 189,730 | 87.9 |
| West | 1,244,011 | 0 | 135,805 | 98,735 | 124,525 | 199,310 | 249,195 | 233,059 | 16,136 | 81.3 |
| Totals | 23,174,757 | 0 | 2,245,300 | 2,243,290 | 2,636,797 | 3,234,759 | 3,382,703 | 2,597,220 | 785,483 | 88.8 |
